

Production

Decide what to produce, when and on which line, with deliveries and margin in one calculation.

Full lines do not mean margin: sequence, capacity and mix count, calculated together. WhAI simulates the plan on real orders and costs and brings the best decision, in euros.

Deliveries kept on time, even in peak weeks

Lower cost of rush jobs, overtime and penalties

More margin from the product mix, same capacity

WhAI comparing production plans on promised dates and margin
THE PROBLEM

The plan is set by department: deliveries, capacity and margin are not calculated together.

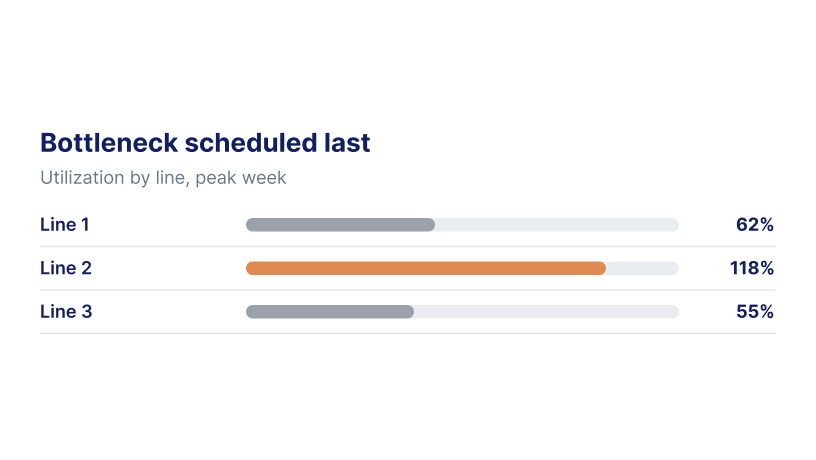
Utilization by line in a peak week, with one line over capacity

Bottleneck scheduled last

In peak weeks the bottleneck goes to the back of the queue while other lines sit free.

Promised order dates slipping across weeks

Deliveries that slip

A plan optimized in the morning is outdated by midday, and promised dates slip.

Share of capacity and margin per hour by product

Mix detached from margin

Lines run full, but the mix follows volumes, not what earns most per hour of capacity.

SOLUTIONS FOR 
Production

From mix to delivery.

The function's recurring decisions, each with its own data and constraints.

PRODUCTION

Product mix

The most profitable mix within capacity and materials, not just the easiest to produce.

  • Margin per hour of capacity used
  • Recipe cost down at the same specifications
  • Less exposure to price rises on single materials
WhAI calculating the product mix that earns most per hour of capacity
PRODUCTION

Product mix

The most profitable mix within capacity and materials, not just the easiest to produce.

  • Margin per hour of capacity used
  • Recipe cost down at the same specifications
  • Less exposure to price rises on single materials
WhAI calculating the product mix that earns most per hour of capacity
PRODUCTION

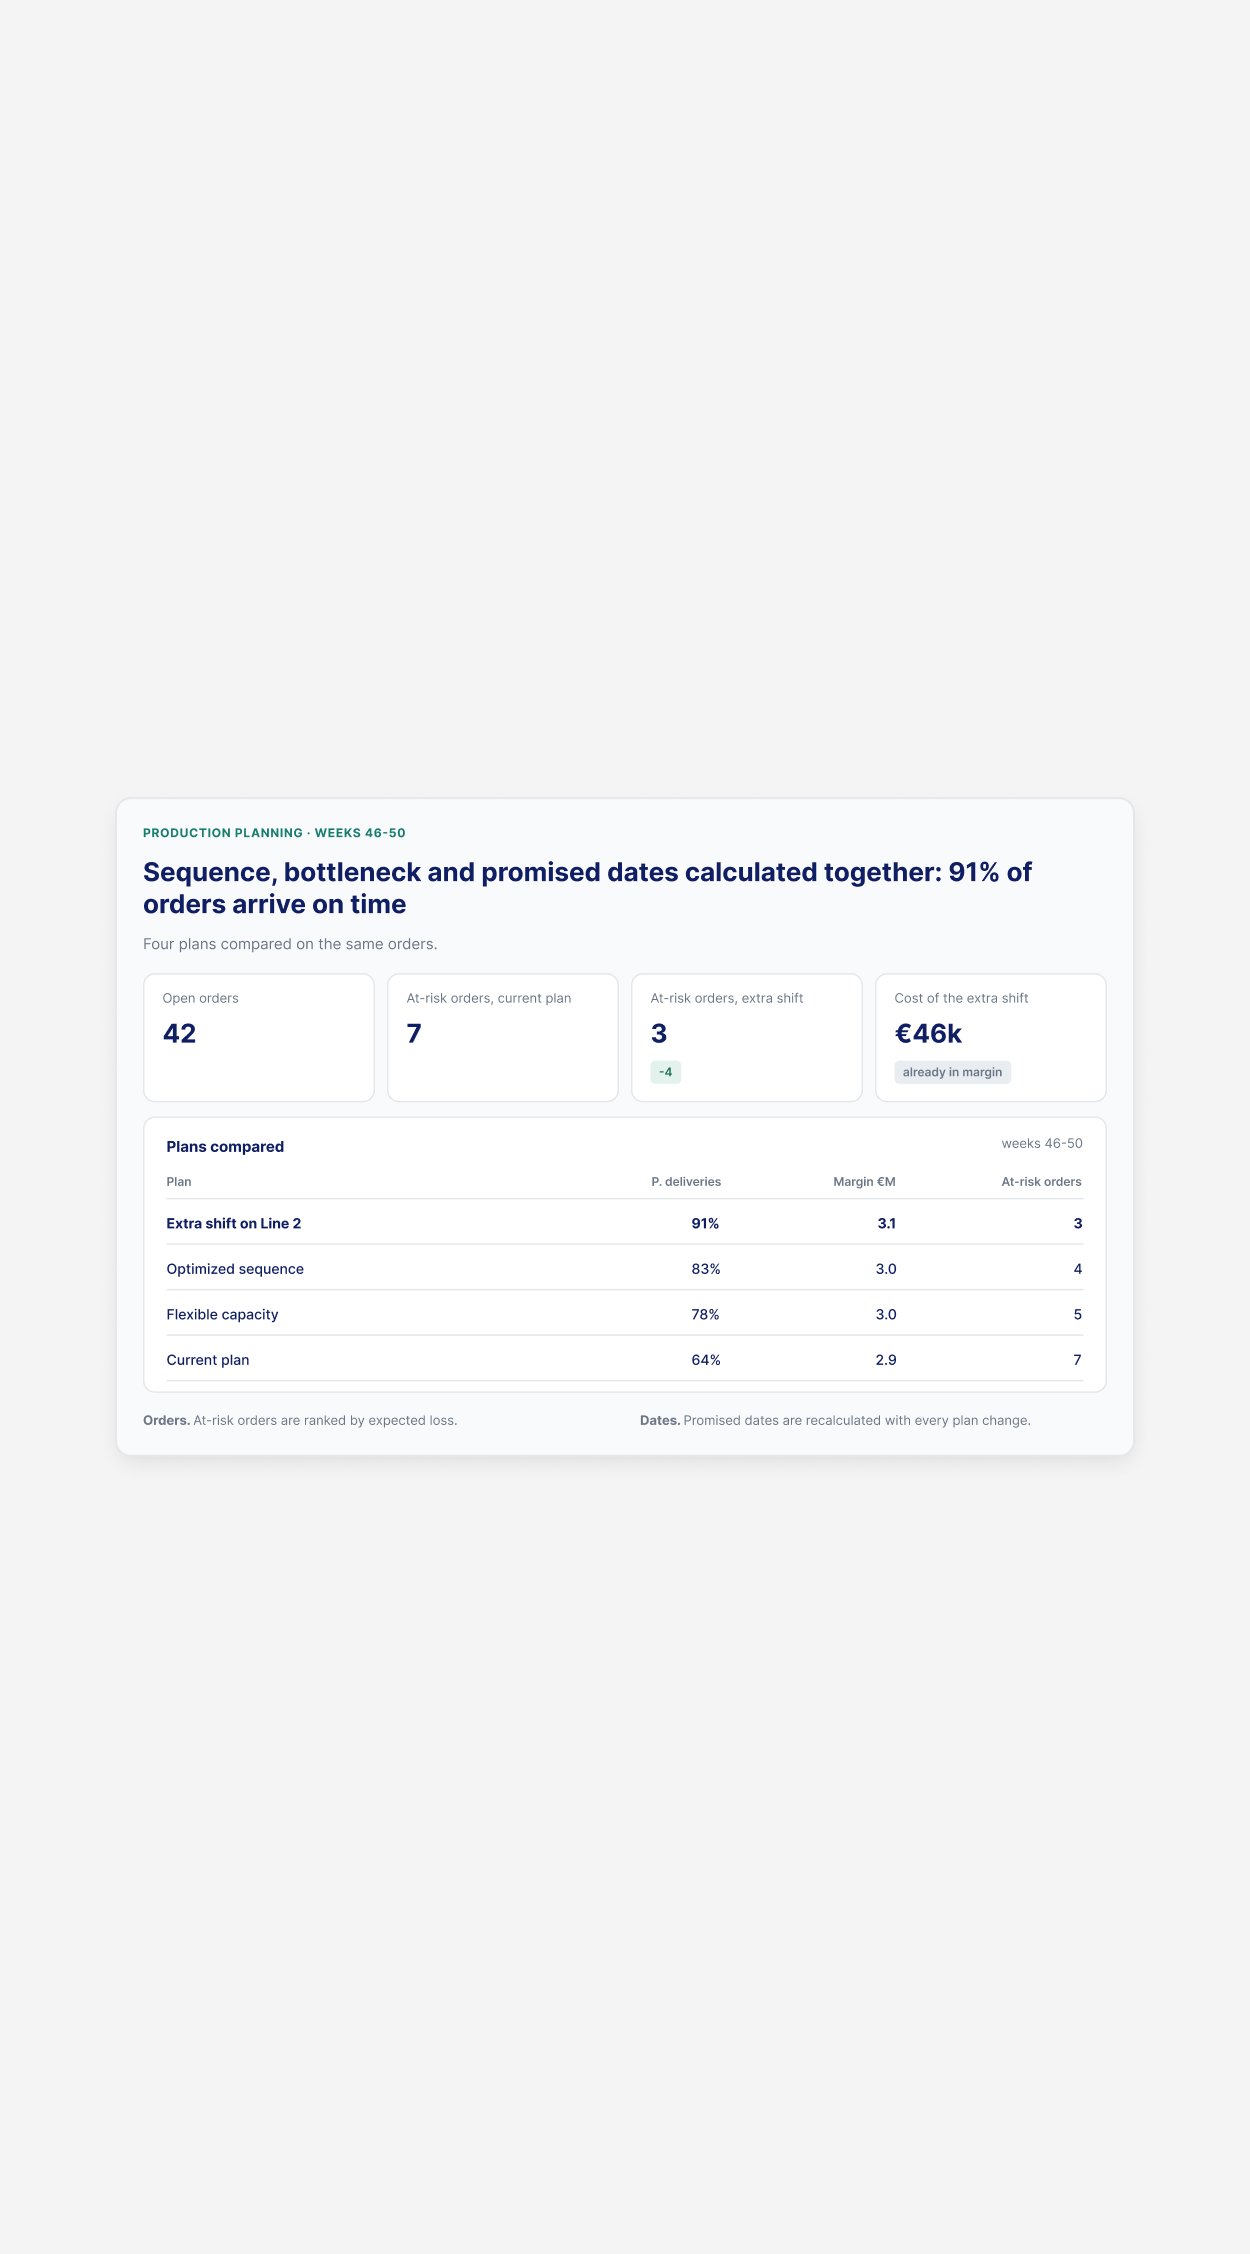
Production planning

Sequence, bottleneck and promised dates calculated together, across the peak weeks.
  • On-time delivery in peak weeks
  • Fewer rush jobs, overtime and penalties
  • At-risk orders ranked by expected loss
WhAI comparing production plans on delivery probability and margin
PRODUCTION

Product mix

The most profitable mix within capacity and materials, not just the easiest to produce.

  • Margin per hour of capacity used
  • Recipe cost down at the same specifications
  • Less exposure to price rises on single materials
WhAI calculating the product mix that earns most per hour of capacity
PRODUCTION

Production planning

Sequence, bottleneck and promised dates calculated together, across the peak weeks.

  • On-time delivery in peak weeks
  • Fewer rush jobs, overtime and penalties
  • At-risk orders ranked by expected loss
WhAI comparing production plans on delivery probability and margin
PRODUCTION

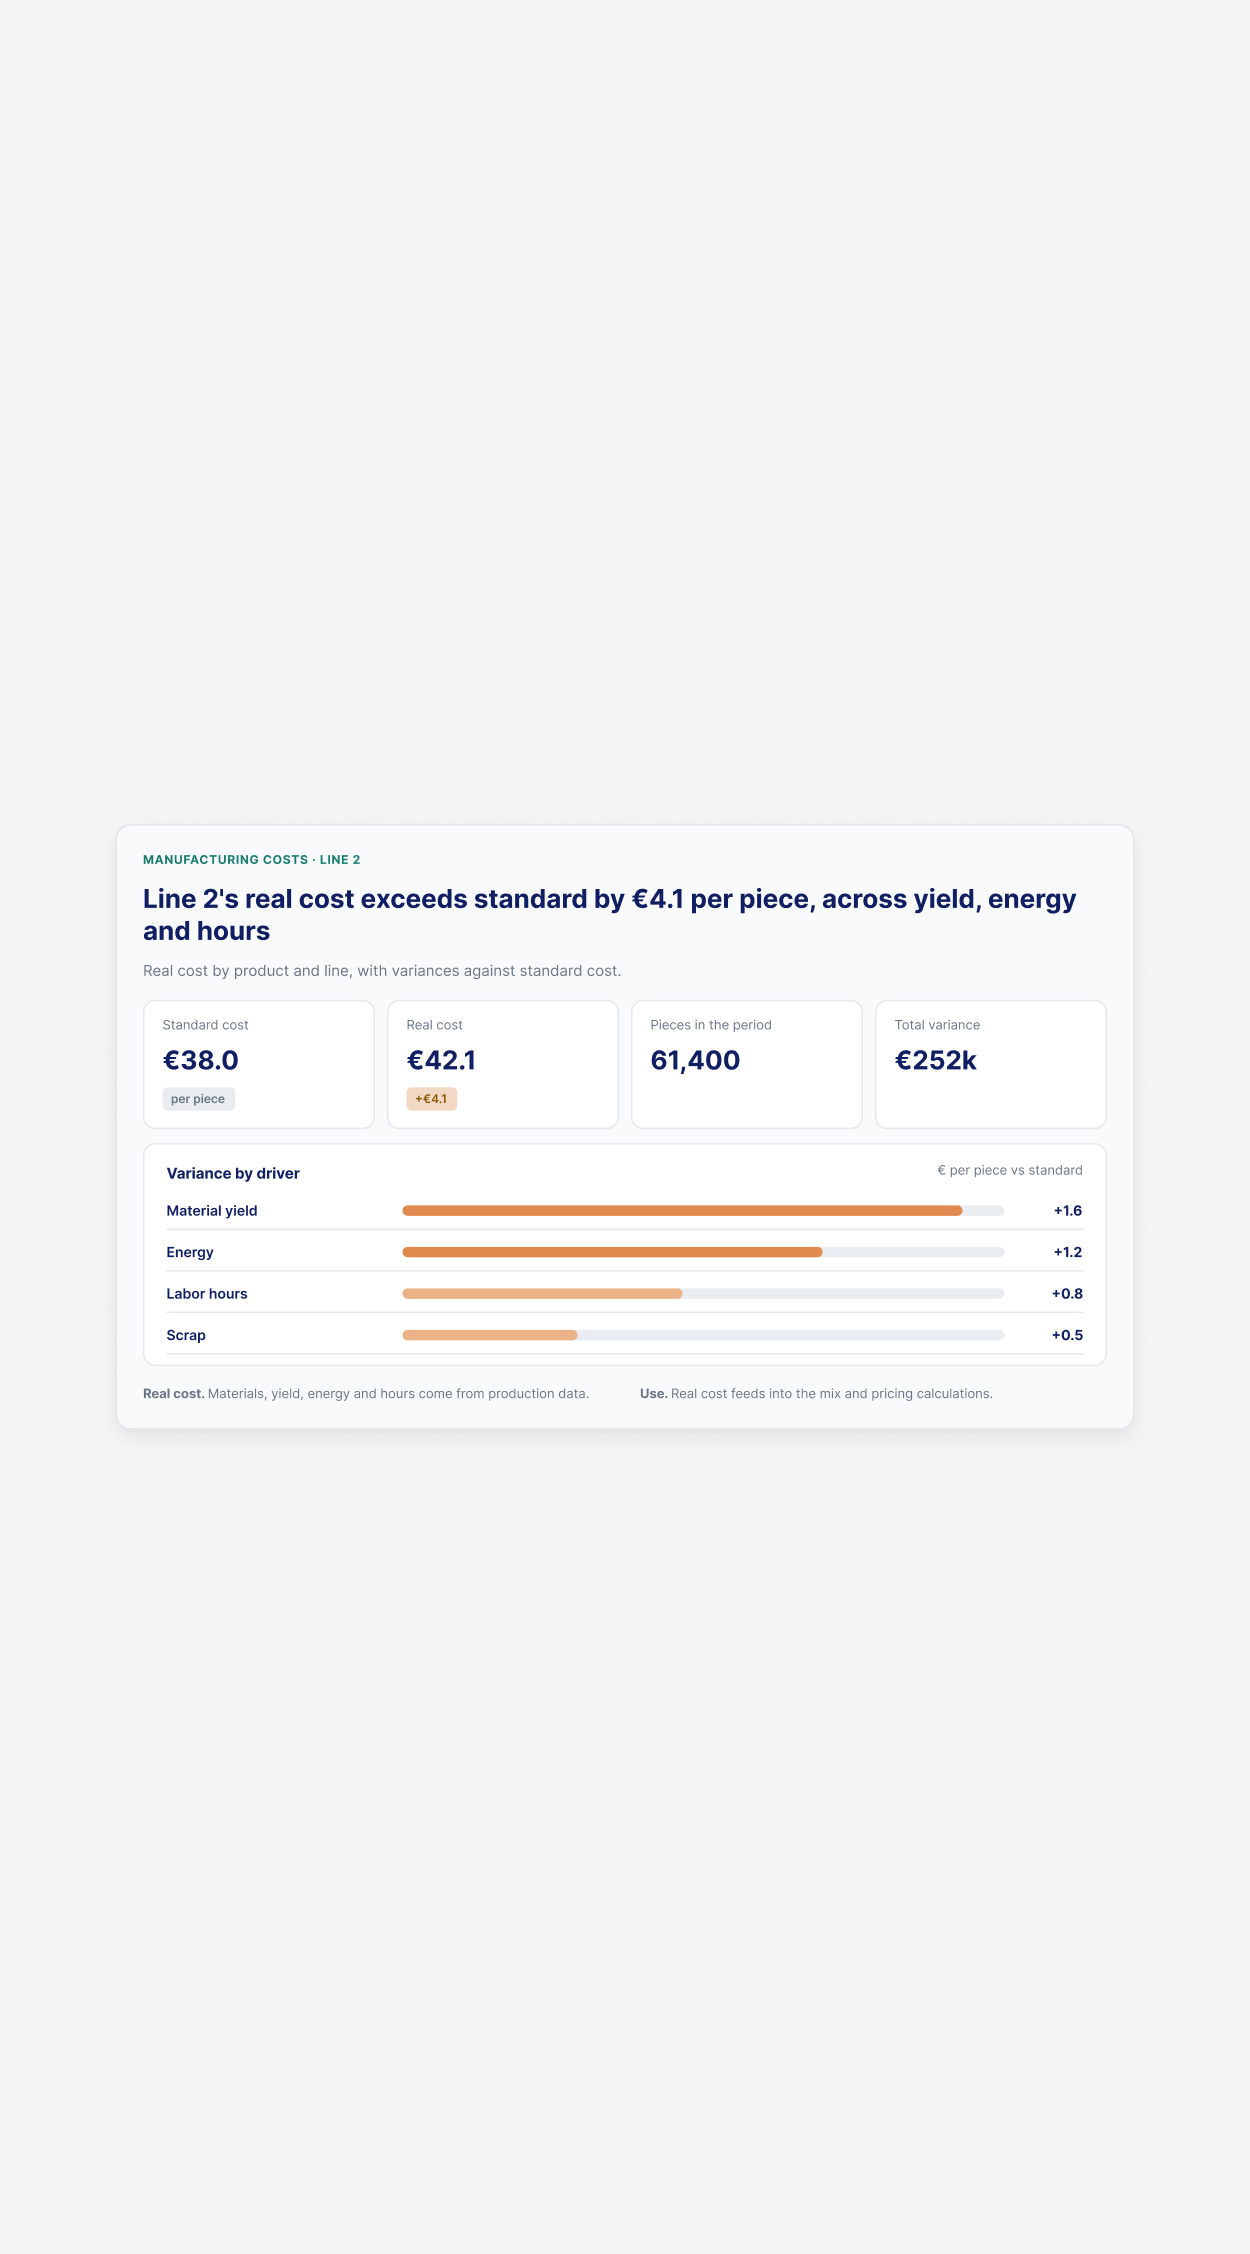
Manufacturing costs

Real cost by product and line, with variances on materials, yield, energy and hours.
  • Product margin measured on real cost
  • Production inefficiencies caught earlier
  • Standard costs updated automatically
WhAI breaking down real cost against standard cost by driver
PRODUCTION

Product mix

The most profitable mix within capacity and materials, not just the easiest to produce.

  • Margin per hour of capacity used
  • Recipe cost down at the same specifications
  • Less exposure to price rises on single materials
WhAI calculating the product mix that earns most per hour of capacity
PRODUCTION

Production planning

Sequence, bottleneck and promised dates calculated together, across the peak weeks.

  • On-time delivery in peak weeks
  • Fewer rush jobs, overtime and penalties
  • At-risk orders ranked by expected loss
WhAI comparing production plans on delivery probability and margin
PRODUCTION

Manufacturing costs

Real cost by product and line, with variances on materials, yield, energy and hours.

  • Product margin measured on real cost
  • Production inefficiencies caught earlier
  • Standard costs updated automatically
WhAI breaking down real cost against standard cost by driver
PRODUCTION

Portfolio analysis

Which products to keep in the catalog and on which lines, on margin at real production cost.

  • Line margin on real production cost
  • Loss-making products repositioned or dropped
  • Cash freed from slow-moving stock
WhAI showing real margin by product at real production cost
A USE CASE

Production planning: deliveries and margin together.

The decision
What to produce, in what sequence and on which lines, respecting deliveries and capacity.
What WhAI does
01
Identifies the bottleneck and the critical weeks
02
Ranks at-risk orders by expected loss
03
Simulates sequence, flexible capacity and promised dates
04
Calculates the best-margin mix within capacity and materials
What the annual return depends on
On-time delivery during peak weeks
Cost of rush jobs, overtime and penalties
Margin of the product mix on the lines
Starting data
Orders, capacity and cycle times per line, BOMs and costs
Who it is for

Operations, Planning, Plant Manager

DECISION INTELLIGENCE

Decisions calculated on your numbers

WhAI: the missing layer for your decisions

WhAI turns the way your company decides into a calculation model. It simulates every choice before you act, estimates the probability of hitting the goal and tracks the outcome.

DISCOVER WHAI
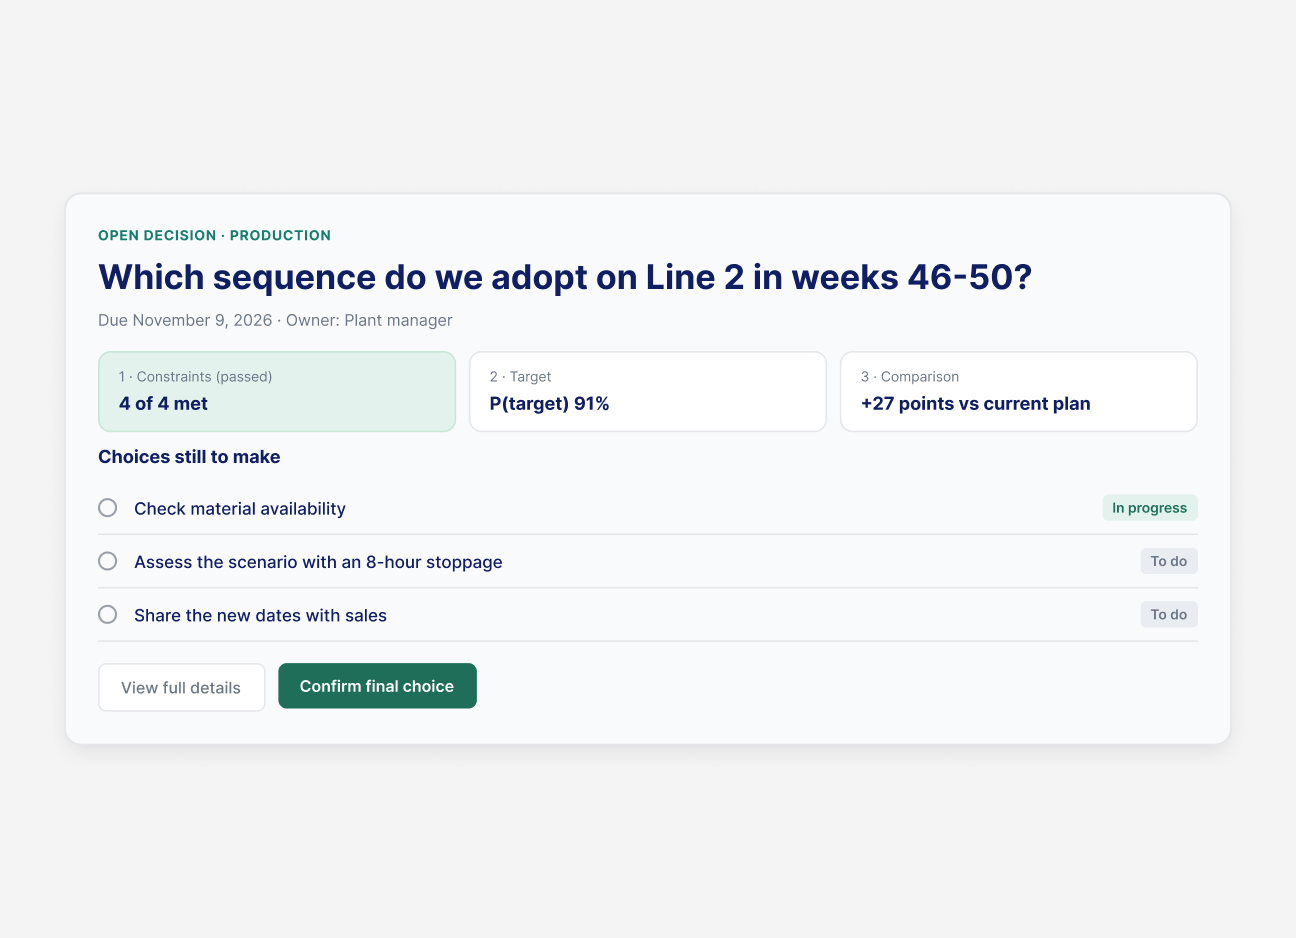
Open production decision in WhAI, with constraints checked and sequences compared
AI Navigator start page: where AI creates the most value in your processes, with a preview of the AI Value MapAI Navigator start page: where AI creates the most value in your processes, with a preview of the AI Value Map
AI NAVIGATOR

Which processes should you bring AI into?

AI Navigator is the assessment that identifies where AI creates the most value and which use case to start with: it cross-references data, process maturity, impact on margins and people, and returns your AI Value Map.

The highest-value use case
The KPIs to track
The estimated annual return

Request a demo

We’ll show you WhAI in action on a real process within your company